A GLP-1 medication level chart drawn from your own doses
The question behind the chart
People on a weekly injection often wonder the same thing: how much of last week's dose is still working, and does that explain how today feels? A dose log answers when. It does not show what happens between one dose and the next, and that gap is where most of the questions live.
What the curve is
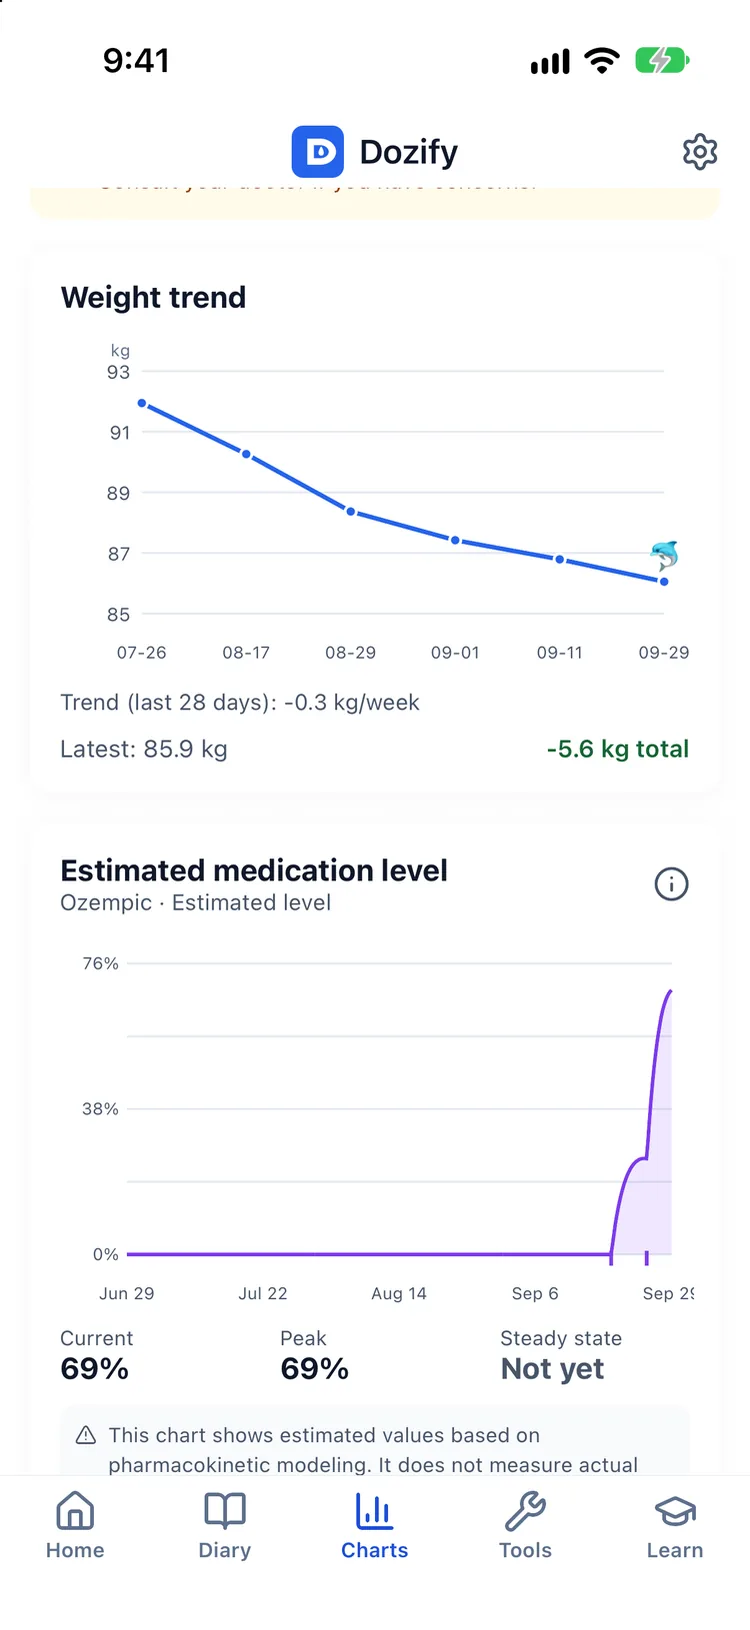
After each injection the estimated level rises, then falls away over time according to the medicine's half-life. Dozify draws that from the doses you log (the date, the amount and the medicine) using a pharmacokinetic profile for each injectable molecule, such as semaglutide in Ozempic® and Wegovy® or tirzepatide in Mounjaro® and Zepbound®. A reference line marks the typical peak for a dose, so you can see where today's estimate sits against it. With regular injections the rise and fall settles into a consistent rhythm, which the app calls steady state.
The screen says it in so many words: "This is an average estimate from pharmacokinetic modeling. It does not measure actual concentration." It is not a blood test, and it knows nothing about your body that your log does not.
Weight and dose on one line
The curve sits on the same timeline as your doses and your weight trend. A dose change, a missed week or a long flat stretch on the scale shows up in context, next to what the medicine was estimated to be doing at the time, instead of in a separate app you have to line up by hand.
Hunger and food noise across the week
If some days of your week feel hungrier than others, the curve gives you something concrete to compare against. Dozify lets you rate food noise in your check-ins and keeps those ratings over time, in the same app as the estimate. You can look at both for the same weeks and see for yourself whether the noisy days tend to land in the same place each week. Whatever you find is your own pattern and worth taking to your prescriber. The app does not explain it, diagnose it or suggest moving a dose because of it.
Injections only
The curve is drawn for injectable medicines. For a medication taken only by mouth, such as Rybelsus® or the Wegovy tablet, Dozify shows no curve at all, because the app has no oral profile and will not invent one. A wrong figure is worse than a blank one. Tablets are still logged, reminded and reported like everything else; the GLP-1 pill tracker page covers how.
Where it stops
The estimate is an average built from a model and your log, so it is only as complete as your entries: a dose you did not log is a dose the curve does not know about. It does not account for how your own body handles the medicine, and the level it shows is not a target. How long a particular medicine stays in the body is set out in its prescribing information, and your pharmacist can walk you through it. Dozify does not recommend a dose, a dose day or a change to either. The curve is part of Premium; dose logging and reminders are free permanently.
Questions
Is this my actual medication level?
No. It is an average estimate from pharmacokinetic modelling, drawn from the doses you logged. It does not measure the concentration in your blood, and the app says so on the screen.
How long does semaglutide stay in the body?
The figure for each medicine is in its prescribing information, and your pharmacist or prescriber can explain what it means for you. What Dozify adds is the shape of it across your own logged doses: when the estimate rises, how it fades, and how one week overlaps the next.
Why is there no curve for my tablet?
The app has no profile for oral medicines, so for a medication taken only by mouth it shows no curve rather than a number it cannot stand behind. Your tablet doses are still logged and reminded as usual.
Is the medication-level chart free?
It is part of Premium, alongside the AI meal photo (after its first free analysis) and the doctor report. Logging doses and getting reminders are free permanently.
Can I use the curve to decide when to take my next dose?
No. Your schedule and dose are your prescriber's to set. The curve is there to help you understand and describe your weeks, not to time or change a dose.
What if I forgot to log a dose?
Add it with the date and time it actually happened. The curve is built from your log, so until the entry is there it does not know about that dose.
Read next
Guides, with their sources named: what GLP-1 actually is, what the leaflet says about a missed dose and how to read a trend when the scale has stalled.
Elsewhere in Dozify: the shot tracker, the side-effect journal, the GLP-1 pill tracker, AI calories and protein from a photo and why your records stay on the phone.